Analytics & estimated votes
Dashboard snapshot, coverage, issues, and a high-level vote estimate vs the win line — not a guarantee.
For campaign adminsRead this first
Dashboard
Admin Dashboard is the snapshot. It does not list every address in the universe. You get:
- Doors knocked — unique doors with a knock on record
- Vote IDed — latest support 4 and 5, with a tiny 1–5 bar
- Estimated votes vs the win line, including how many votes and what percent you are above or below it
- Vote IDs over time — a running total of first-time 4s and 5s, week by week
- Signs requested and installed over time — two running totals on one chart. The card opens Signs → Plan, where you project how many boards you still need by a date you pick
- Support rate over time (the same 4–5 trend as Estimated Votes)
- All-time doors leaderboard (podium plus the next few names)
- Signs requested still waiting vs signs already in the ground
- One map of your 4s and 5s plus every lawn sign currently installed
Each card opens the full page behind it — Analytics, Estimated Votes, GOTV, Signs, or Map & Turfs. The numbers here are the same model as Estimated Votes, including the disclaimer below.
Analytics
Open Analytics for:
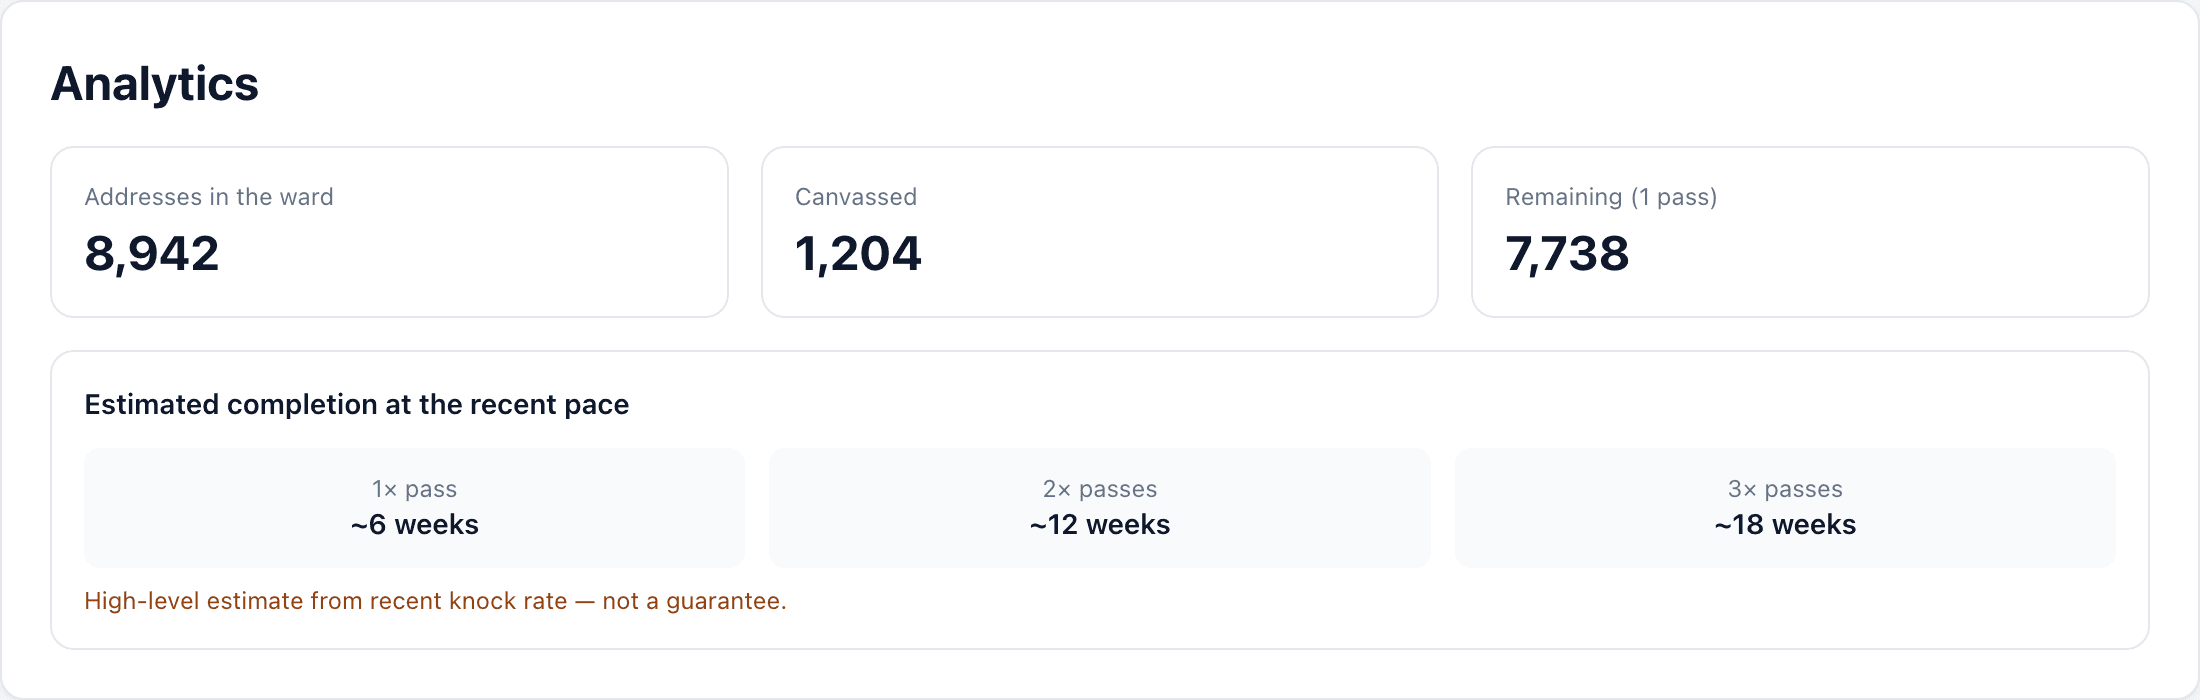
- Addresses in the ward, canvassed, and remaining (1 pass)
- Completion estimate at recent pace for 1× / 2× / 3× passes (or “not enough recent canvassing to estimate”)
- Support histogram and weekly knock rate
- AI issue analysis from notes and tags (PII stripped before analysis)
- Leaderboard (doors, pace, signs, positive IDs, and more)
Estimated Votes
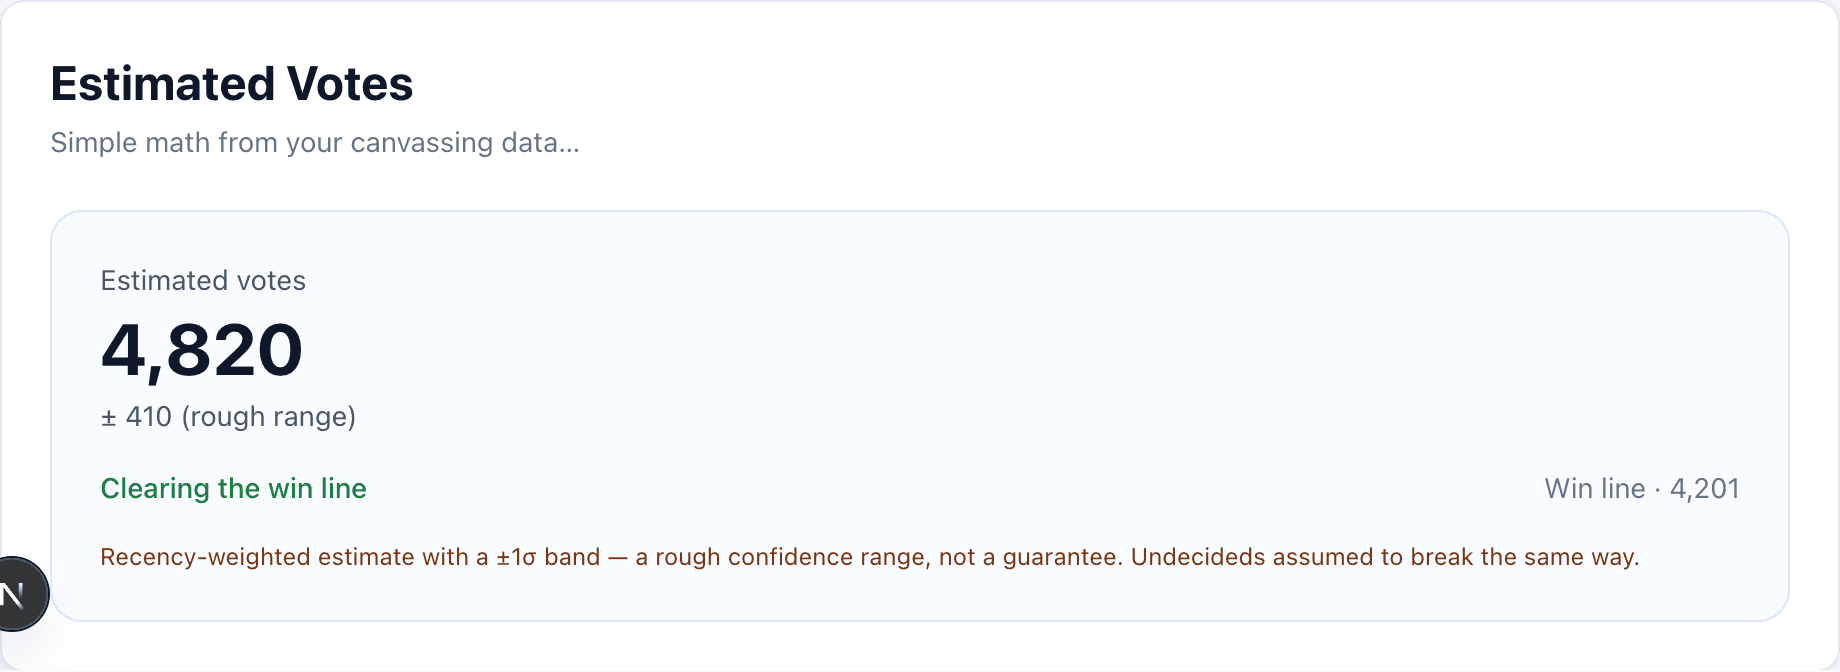
Estimated Votes does simple math from your knocks: a recency-weighted 4–5 support rate, projected against an electorate × expected turnout win line (50% + 1 of expected turnout). You will see a headline estimate with a margin of error, a verdict (clearing, too close to call, or below), a waterfall, and a weekly support trend whose band narrows as coverage grows. The ± on the support rate is added and subtracted from that rate: 40% ± 5% means 35–45%, the same way a poll is written. The headline ± next to the vote count is votes, not a percent.
Where the margin of error comes from
The margin is built from the spread between your canvasses, not just the number of doors. Each canvass is one turf on one day, and turfs lean differently — so 300 doors from three similar streets tell you less than 300 doors from ten scattered ones. Two parts are combined:
- Sampling margin — a 95% interval on the support rate, treating canvasses as the sampling units (a cluster-robust standard error with a Student-t multiplier for how many canvasses you have). If your canvasses disagree more than chance would explain, the page shows that as a design effect above 1×.
- Coverage allowance — the share of the ward you have not canvassed, multiplied by how much your turfs have differed from each other so far. If 18% of the ward is covered, the other 82% is allowed to lean off by about one typical turf-to-turf gap.
The two are combined as √(sampling² + coverage²). Those pieces are percents on the 4–5 rate (40% ± 5% is 35–45%). The page then multiplies the combined percent by expected turnout to get ± votes on the headline. When the win line falls inside that vote range the verdict is too close to call.
Assumptions to keep in mind
- It treats each canvass as a random sample of the ward. It is not — you choose which turfs to walk, and some neighbourhoods lean much more your way than others. The coverage allowance is a partial correction, not a cure.
- Doors that answer stand in for voters who turn out, and undecided 3s are counted at your 4–5 support rate (shown in parentheses on the waterfall), not as if they all become yours.
- Electorate, turnout, and a two-way race are your inputs; change them and the win line moves.
- Accuracy improves with more coverage, more canvasses in new turfs, and proximity to election day (opinions settle, and recent weeks count more).
- At the end of the day, this is just a model.
Raw rows and CRM export stay in Data & Export.
Once voting starts, a separate Confirmed votes box appears under the model: supporters your GOTV team has marked as having voted. It is kept apart from the estimate on purpose — the estimate is a forecast for the whole ward, confirmed votes are a floor of real ballots.
Try the demos (sample data)
These interactive demos use sample data — safe to poke without a login.